Organized and Documented by Qiwen Lei
Research
Background Research
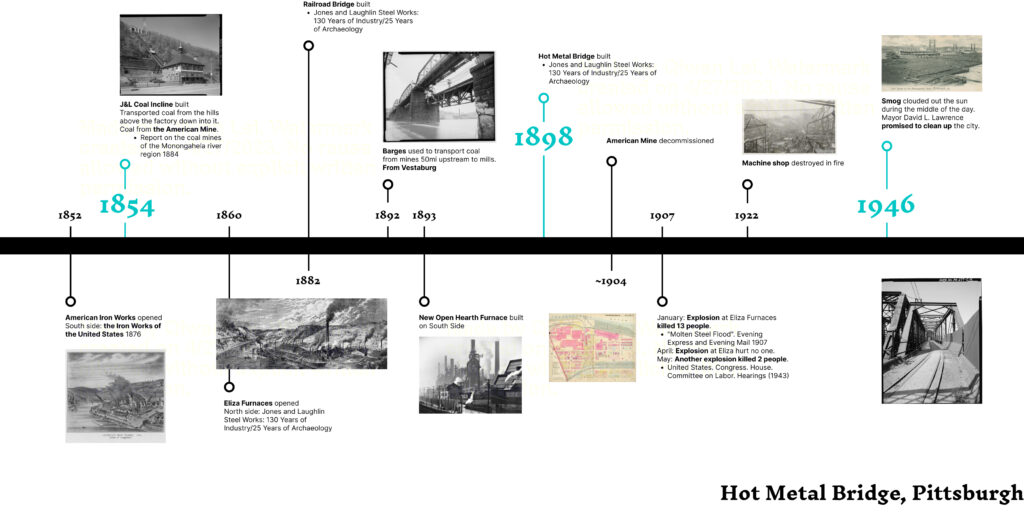
To ensure the accuracy and reliability of the information presented in our product, we conducted background research on the city of Pittsburgh and the Hot Metal Bridge. We read through some history papers and blogs, watched historical documentation, and reviewed photographs and maps as background research of the Hot Metal bridge. Our research revealed that the period from the 1800s to the 1900s was a crucial era for Pittsburgh, as it had experienced prosperity due to the steel industry.
Here are Pittsburgh timeline we summarized from 1852 to 1946.
Field Trip
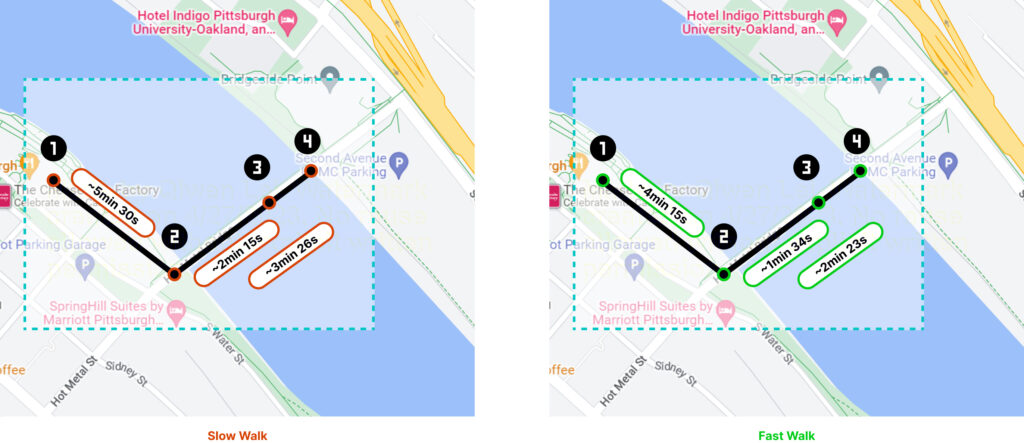
During our field trips, we explored the bridge and observed the time an average person spent walking across it and identified good viewing points with fewer objects locking users’ view. In doing so, we gained valuable insights into the bridge’s usage and attractiveness.
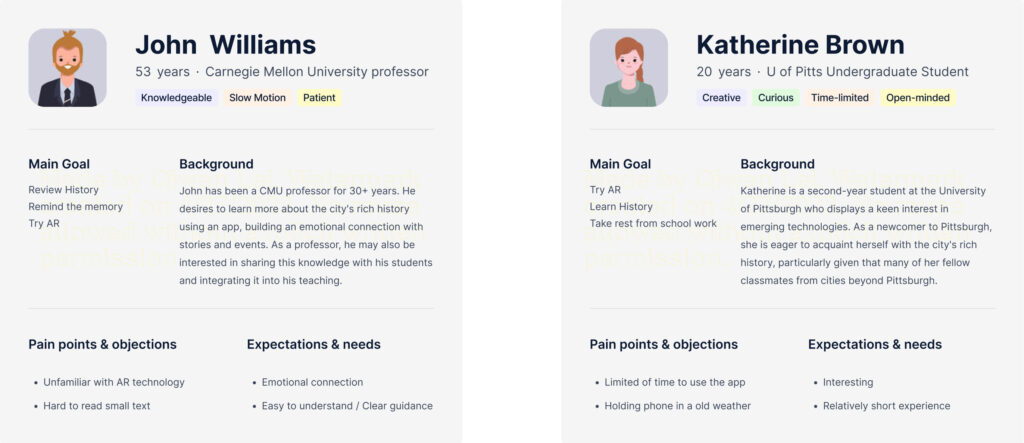
As we ventured across the bridge, we couldn’t help but notice the two distinct groups of people who always seemed to be walking across it: residents who live nearby and tourists. It was fascinating to see how each group approached the bridge differently, with the residents crossing it with a sense of familiarity and the tourists eagerly taking in the sights and sounds around them.
User Persona
Based on the results of our background research and field trip explorations, we have determined that our target user groups are tourists and nearby residents. To gain a deeper understanding of their perspectives while walking across the Hot Metal Bridge, we have developed one persona for each group.
User Journey Map
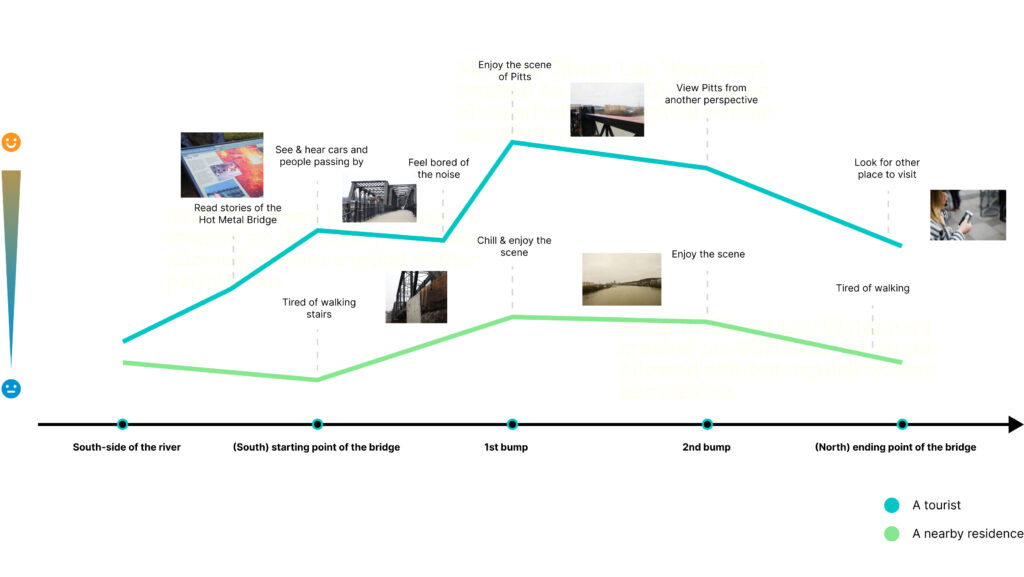
After creating detailed personas of our target users, which are based on our analysis of their emotions and actions, we construct a user journey map that outlines the key actions and interactions of the user as they navigate the Hot Metal bridge. This journey map specifically focuses on the user’s path from the south side of the river to the north side of the bridge.
By drawing this user journey map, we can better understand users’ needs and behaviors, improve user experience, enhance usability, and support decision-making. This results in a user-centered design approach that prioritizes the needs and preferences of the users and leads to a better user experience and greater satisfaction.
Analysis and Brainstorm
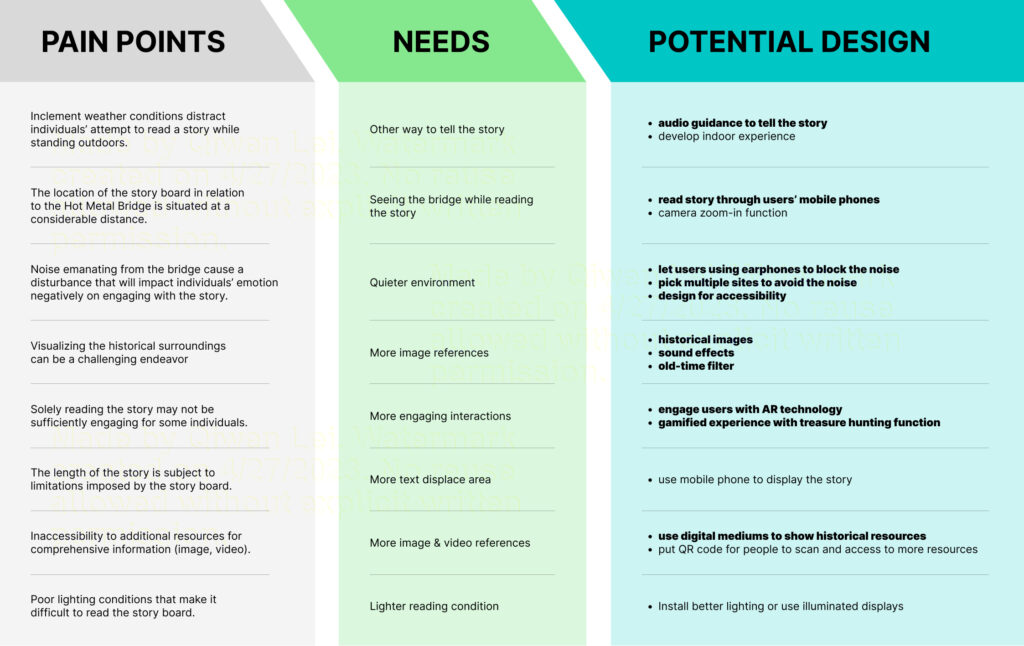
To create a better user experience and ensure that our product meets the needs and preferences of the target users, we summarize users’ pain points, analyze their needs and brainstorm some potential designs.
After communicating within the team, with instructors and faculties, we highlight the features we would like to include in our product.
Reference List:
Documentation: History to Go the Carrie Furnaces
https://www.brooklineconnection.com/history/Facts/Inclines.html#joneslaughlin
https://historicpittsburgh.org/islandora/object/pitt%3AMSP33.B007.F05.I01
https://historicpittsburgh.org/islandora/object/pitt%3AMSP33.B009.F01.I18
“Molten Steel Flood”. Evening Express and Evening Mail 1907
United States. Congress. House. Committee on Labor. Hearings (1943)
https://historicpittsburgh.org/islandora/object/pitt%3AMSP33.B007.F14.I03
https://positivelypittsburgh.com/darkhistory/
https://historicpittsburgh.org/islandora/object/pitt%3AMSP33.B007.F14.I03
